Lavaca County

Population
Back To Top
Population
| Population | 2000 | 2010 | 2023 | 2028 |
|---|---|---|---|---|
| Lavaca County | 19,210 | 19,263 | 20,657 | 20,861 |
Source: ESRI, 2023-10-17
Population by Age
| Population | 2010 | 2023 | 2028 |
|---|---|---|---|
| 0-4 | 1,227 | 1,156 | 1,142 |
| 5-9 | 1,226 | 1,257 | 1,239 |
| 10-14 | 1,232 | 1,228 | 1,351 |
| 15-19 | 1,166 | 1,140 | 1,160 |
| 20-24 | 815 | 874 | 875 |
| 25-29 | 925 | 961 | 837 |
| 30-34 | 909 | 1,034 | 911 |
| 35-39 | 976 | 1,045 | 1,092 |
| 40-44 | 1,095 | 1,134 | 1,138 |
| 45-49 | 1,365 | 1,092 | 1,221 |
| 50-54 | 1,421 | 1,225 | 1,132 |
| 55-59 | 1,436 | 1,412 | 1,284 |
| 60-64 | 1,381 | 1,642 | 1,452 |
| 65-69 | 1,106 | 1,579 | 1,626 |
| 70-74 | 924 | 1,451 | 1,501 |
| 75-79 | 773 | 1,048 | 1,244 |
| 80-84 | 596 | 700 | 885 |
| 85+ | 690 | 679 | 771 |
| 18+ | 14,815 | 16,288 | 16,388 |
| Median Age | 45 | 47 | 48 |
Source: ESRI, 2023-10-17
Population by Race
| Lavaca County | 2023 |
|---|---|
| Total | 20,657.00 |
| White Alone | 76.58 |
| Black Alone | 6.57 |
| American Indian Alone | 0.56 |
| Asian Alone | 0.41 |
| Pacific Islander Alone | 0.02 |
| Some Other Race | 5.99 |
| Two or More Races | 9.86 |
| Hispanic Origin | 20.12 |
| Diversity Index | 59.00 |
Source: ESRI, 2023-10-17
Growth Rate
| Lavaca County | 2023 - 2028 |
|---|---|
| Population | 0.20% |
| Households | 0.32% |
| Families | 0.31% |
| Median Household Income | 3% |
| Per Capita Income | 2% |
Source: ESRI, 2023-10-17
Back To TopHousing
Back To Top
Households
| Population | 2000 | 2010 | 2023 | 2028 |
|---|---|---|---|---|
| Households | 7,669 | 7,808 | 8,354 | 8,488 |
| Housing Units | 9,657 | 10,344 | 10,641 | 10,759 |
| Owner Occupied Units | 6,293 | 6,431 | ||
| Renter Occupied Units | 2,061 | 2,057 | ||
| Vacant Units | 2,287 | 2,271 |
Source: ESRI, 2023-10-17
Home Value
| Lavaca County | 2023 | 2028 |
|---|---|---|
| Median Home Value | $233,499 | $254,434 |
| Average Home Value | $299,265 | $320,020 |
| <$50,000 | 365 | 326 |
| $50,000 - $99,999 | 875 | 782 |
| $100,000 - $149,999 | 537 | 483 |
| $150,000 - $199,999 | 865 | 777 |
| $200,000 - $249,999 | 753 | 788 |
| $250,000 - $299,999 | 644 | 671 |
| $300,000 - $399,999 | 862 | 1,000 |
| $400,000 - $499,999 | 634 | 731 |
| $500,000 - $749,999 | 421 | 485 |
| $1,000,000 + | 54 | 61 |
Source: ESRI, 2023-10-17
Housing Year Built
| Year Range | Houses Built |
|---|---|
| 2010 or Later | 944 |
| 2000-2009 | 1,185 |
| 1990-1999 | 1,082 |
| 1980-1989 | 1,257 |
| 1970-1979 | 1,470 |
| 1960-1969 | 1,061 |
| 1950-1959 | 1,180 |
| 1940-1949 | 869 |
| 1939 or Before | 1,376 |
Source: ESRI, 2023-10-17
Back To TopIncome
Back To Top
Income
| Lavaca County | 2023 | 2028 |
|---|---|---|
| Median Household | $59,508 | $67,549 |
| Average Household | $87,919 | $98,297 |
| Per Capita | $35,582 | $40,022 |
Source: ESRI, 2023-10-17
Household Income Base
| Lavaca County | 2023 |
|---|---|
| <$15,000 | 698 |
| $15,000 - $24,999 | 871 |
| $25,000 - $34,999 | 815 |
| $35,000 - $49,999 | 1,178 |
| $50,000 - $74,999 | 1,312 |
| $75,000 - $99,999 | 988 |
| $100,000 - $149,999 | 1,486 |
| $150,000 - $199,999 | 507 |
| $200,000+ | 499 |
Source: ESRI, 2023-10-17
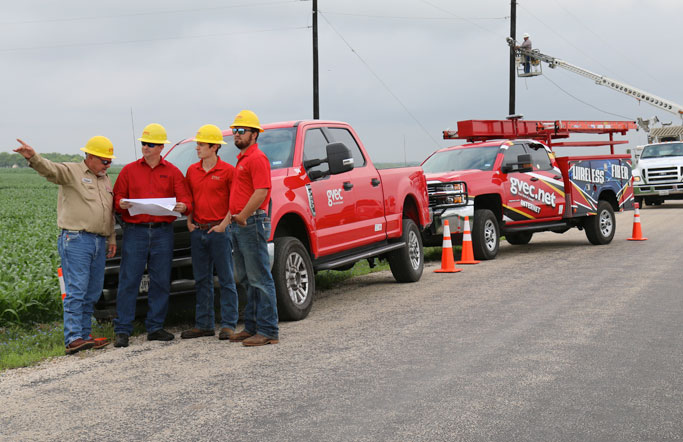
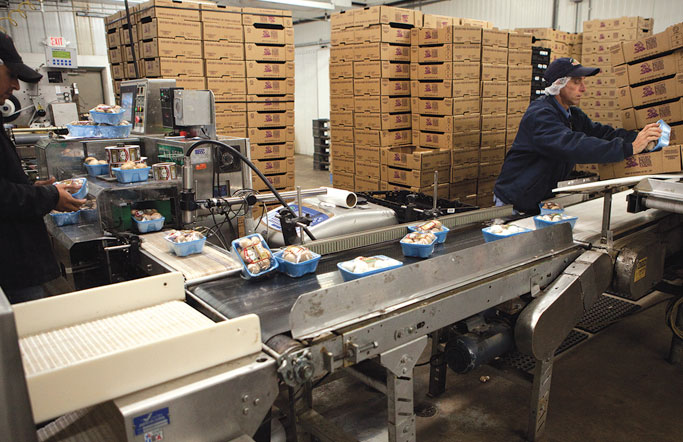
Back To TopEmployees
Back To Top
Commute
| Category | Commuters |
|---|---|
| Workers 16+ | 9,032 |
| In-County Residents | 5,379 |
| Out-of-County Residents | 3,638 |
| Drive Alone | 7,344 |
| Carpooled | 987 |
| Public Transport | 0 |
| Work at Home | 512 |
| Less than 5 minutes | 731 |
| 5-9 minutes | 1,651 |
| 10-14 minutes | 1,131 |
| 15-19 minutes | 798 |
| 20-24 minutes | 1,016 |
| 25-29 minutes | 472 |
| 30-34 minutes | 755 |
| 35-39 minutes | 121 |
| 40-44 minutes | 254 |
| 45-59 minutes | 468 |
| 60-89 minutes | 601 |
| 90+ minutes | 522 |
| Average Travel Time | 27 |
Source: ESRI, 2023-10-17
Source: ESRI, 2023-10-17
Employees by NAICS
| Category | Number |
|---|---|
| Total Employees | 8,451 |
| Agr/Forestry/Fish/Hunt | 40 |
| Mining | 1,216 |
| Utilities | 33 |
| Construction | 434 |
| Manufacturing | 1,035 |
| Wholesale Trade | 1,163 |
| Retail Trade | 747 |
| Motor Veh/Parts Dealers | 97 |
| Furn & Home Furnish Str | 18 |
| Electronics & Appl Store | 7 |
| Bldg Matl/Garden Equip | 85 |
| Food & Beverage Stores | 204 |
| Health/Pers Care Stores | 25 |
| Gasoline Stations | 74 |
| Clothing/Accessory Store | 57 |
| Sports/Hobby/Book/Music | 48 |
| General Merchandise Str | 132 |
| Misc Store Retailers | 0 |
| Nonstore Retailers | 0 |
| Transportation/Warehouse | 85 |
| Information | 25 |
| Finance & Insurance | 166 |
| Cntrl Bank/Crdt Intrmdtn | 103 |
| Sec/Cmdty Cntrct/Oth Inv | 18 |
| Insur/Funds/Trusts/Other | 45 |
| Real Estate/Rent/Leasing | 74 |
| Prof/Scientific/Tech Srv | 188 |
| Legal Services | 29 |
| Mgmt of Comp/Enterprises | 4 |
| Admin/Support/Waste Mgmt | 32 |
| Educational Services | 997 |
| HealthCare/Social Assist | 1,082 |
| Arts/Entertainment/Rec | 112 |
| Accommodation/Food Srvcs | 300 |
| Accommodation | 55 |
| Food Srv/Drinking Places | 245 |
| Other Srv excl Pub Admin | 266 |
| Auto Repair/Maintenance | 68 |
| Public Administration Emp | 452 |
Source: ESRI, 2023-10-17
Educational Attainment (25+)
| Lavaca County | 2023 |
|---|---|
| Some High School | 838 |
| Graduated High School | 5,546 |
| Associates Degree | 1,149 |
| Bachelor's Degree | 2,098 |
| Graduate Degree | 737 |
Source: ESRI, 2023-10-17
Back To TopBusinesses
Back To Top
Businesses by NAICS
| Category | Number |
|---|---|
| Total Businesses | 717 |
| Agr/Forestry/Fish/Hunt Bus | 18 |
| Mining Bus | 5 |
| Utilities Bus | 2 |
| Construction Bus | 43 |
| Manufacturing Bus | 36 |
| Wholesale Trade Bus | 32 |
| Retail Trade Bus | 117 |
| Motor Veh/Parts Dealers Bus | 13 |
| Furn & Home Furnish Str Bus | 5 |
| Electronics & Appl Store Bus | 1 |
| Bldg Matl/Garden Equip Bus | 18 |
| Food & Beverage Stores Bus | 23 |
| Health/Pers Care Stores Bus | 4 |
| Gasoline Stations Bus | 14 |
| Clothing/Accessory Store Bus | 4 |
| Sports/Hobby/Book/Music Bus | 22 |
| General Merchandise Str Bus | 13 |
| Misc Store Retailers Bus | 0 |
| Nonstore Retailers Bus | 0 |
| Transportation/Warehouse Bus | 11 |
| Information Bus | 8 |
| Finance & Insurance Bus | 33 |
| Cntrl Bank/Crdt Intrmdtn Bus | 12 |
| Sec/Cmdty Cntrct/Oth Inv Bus | 6 |
| Insur/Funds/Trusts/Other Bus | 15 |
| Real Estate/Rent/Leasing Bus | 27 |
| Prof/Scientific/Tech Srv Bus | 48 |
| Legal Services Bus | 9 |
| Mgmt of Comp/Enterprises Bus | 1 |
| Admin/Support/Waste Mgmt Bus | 14 |
| Educational Services Bus | 26 |
| HealthCare/Social Assist Bus | 45 |
| Arts/Entertainment/Rec Bus | 21 |
| Accommodation/Food Srvcs Bus | 46 |
| Accommodation Bus | 14 |
| Food Srv/Drinking Places Bus | 32 |
| Other Srv excl Pub Admin Bus | 94 |
| Auto Repair/Maintenance Bus | 19 |
| Public Administration Bus | 66 |
Source: ESRI, 2023-10-17
Back To Top